Welcome back to our tutorial series on Sympathy for Data. In our previous session, we learned how to use the data viewer to explore data. Today, we'll walk you through the process of cleaning up data.
Step 1: Opening the Data Viewer

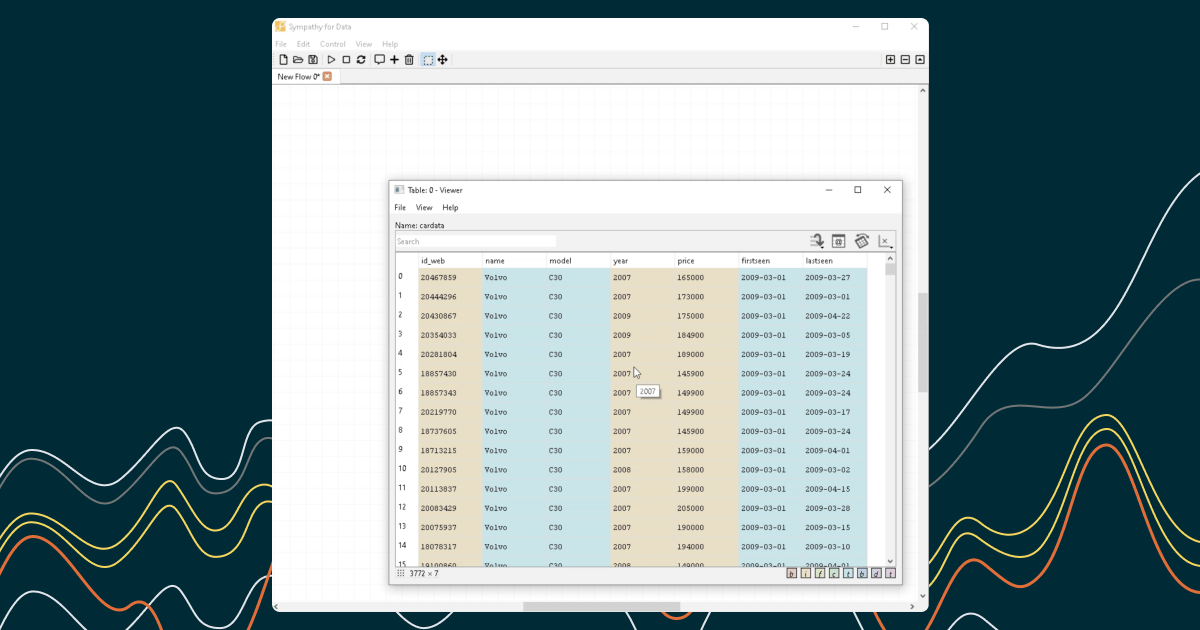
Just as before, start by double-clicking on the output port to bring up the data viewer. Right-click on the "year" column and select "Plot column as y". You may notice a data point around the year 4000.
Step 2: Identifying Outliers

Use the magnifying glass to zoom in on the main data, which is typically located between 1985 and 2010. Outside this range, there are only a few data points. This suggests that we may need to clean up our data. Close the data viewer once you've identified the outliers.
Step 3: Connecting a New Node

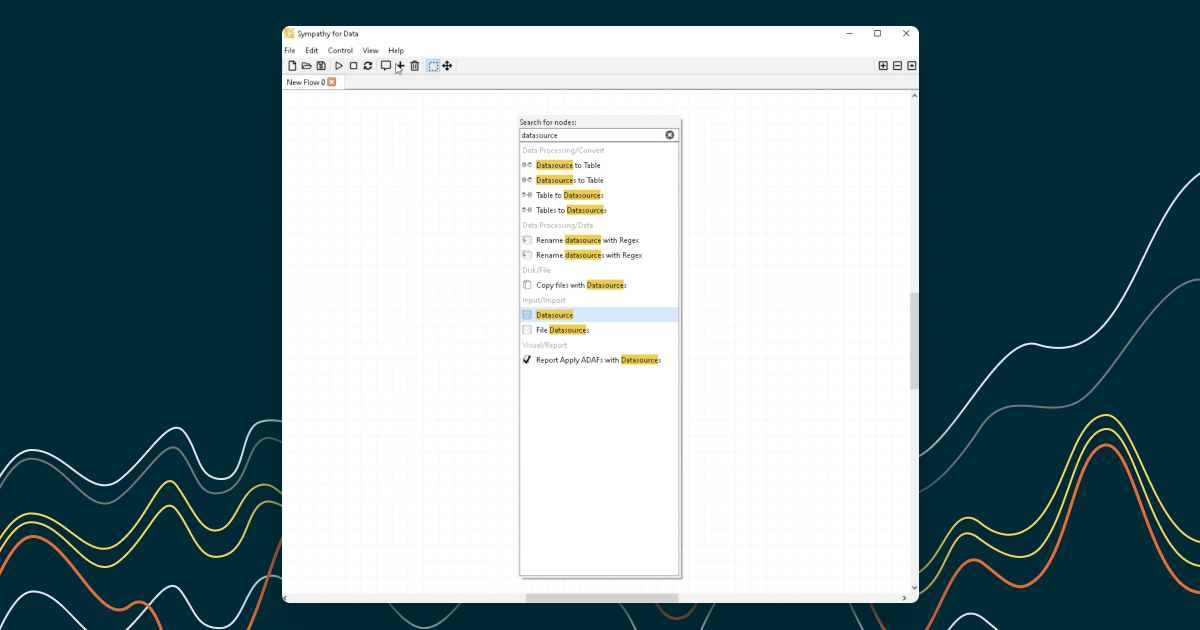
To clean up the data, you'll need to connect a new node. Drag from the output port and drop to initiate the connection, then choose "Select rows in Table".
Step 4: Configuring the New Node


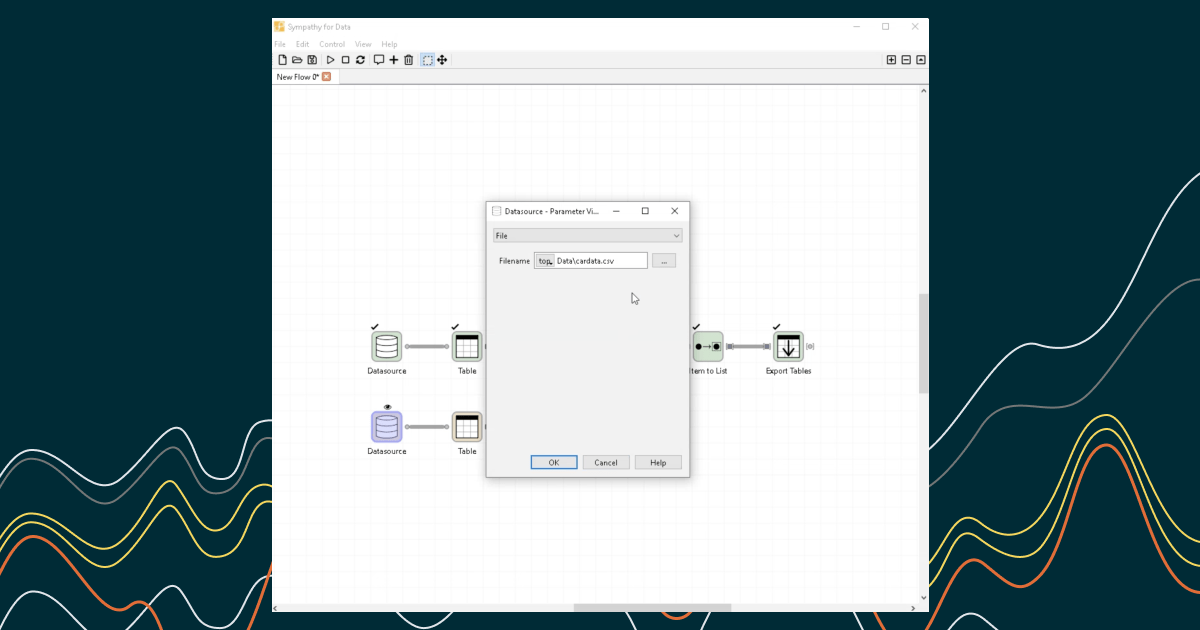
You'll need to configure this node to filter the data based on the year. Set the filter to exclude years older than 1985. Once you're satisfied with your settings, press OK to save the configuration.
Step 5: Executing the Node

After you've saved your configuration, execute the node to implement your changes.
Step 6: Adding Another Node
Next, you'll need to start connecting another new node. Again, choose "Select rows in Table".
Step 7: Configuring the Second Node

Configure this second node to filter out odd data from future years. To do this, set the filter to exclude years after 2010. Save this configuration once you've finished.
Step 8: Executing the Second Node
As before, execute the node to implement your changes.
Step 9: Checking the Filtered Data

With the data now cleaned, bring up the data viewer for the output port to confirm that the appropriate rows were filtered. Plot the "year" column on the y-axis to visualize your data.
Step 10: Reviewing the Results

As a result of your cleaning, data points outside the range from 1986 to 2009 should have been removed. To get a better view of the cleaned data, plot the "year" on the x-axis and the "price" on the y-axis. The plot now should look similar to the one we zoomed into in our last session.
Once you're done reviewing your cleaned data, you can close the viewer. And that's it! You now know how to clean up data using Sympathy for Data. Keep practicing these steps to get comfortable with the process.
Thanks for watching and stay tuned for more!